 It creates situations which these students experienced in real life. Thus, stimulation and virtual reality are possible. by means of virtual reality (Rs) extension systems, the computer can create 3 D images or display to give the user the feeling that is situated in a virtual environment. a flight simulation program is an example of situating tools which places the user in a simulated flying environment.
  Situation tools are similar to constructive tools in that they also, allow entire users to manipulate variables in the systems. however, the focus of situating tools is not much on the manipulation of variable but more on situating student in an environment for certain instructional purposes, for this reason, depending on the instructional objective, a simulation program can be a constructive tool but it can also be a situating tool.
 Constructing or observing a 2d graph using graphcalc shapes
Open graphical
Click on graph 1
Click on 2d graph
Click on equation
Enter the given equation by ticking on y1
To add more equation keep on ticking ybox and keep on adding equation
To delete the graph un tick the ybox
To save the file click on 2d graph
Click on save as bitmap
 Constructing or observing a 2d graph using geogebra shapes
Go to input view and type the equation
Keep on adding equation in input view to add the graph
To create slider type
To save and if we want to modify the graph in future go to file and click on save as
Click on file and click on export and select second option and click on save in dialog box so here we cannot modify graph in future


 4. Click the button on the right hand side of the page and select geometry


6. Draw the line segment AB using the Segment between two points tool
7. Click to a perpendicular line tool to draw a perpendicular line.
8. Click on the line drawn in step 6 to draw a perpendicular line. (After clicking drag a line to point B)
9. From point B draw a circle through point A using the Circle with Centre through a Point tool
10. Now add a new point C on the intersection point.
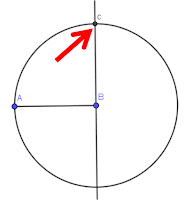
11. Repeat step 8 to draw a perpendicular line. (This time drag a line to point A)

12. From A draw a circle through B using the Circle with Centre through a Point tool

Concept:
A square will have all four angles equal. All the angles are 90°.
Situating tool using Geogebra: Constructing Square
Procedures:
1. First click on Geogebra icon from desktop

2. Click on the button near to the graphics to make the blank page.

3. Click to grid and axes to hide the grid and axes.
4. Click the button on the right hand side of the page and select geometry
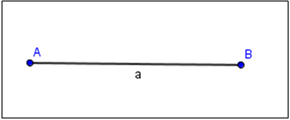
5. Draw two points A and B using the New Point tool

6. Draw the line segment AB using the Segment between two points tool
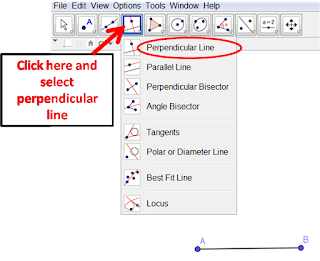
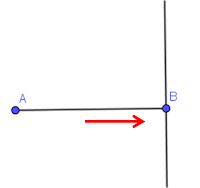
7. Click to a perpendicular line tool to draw a perpendicular line.

8. Click on the line drawn in step 6 to draw a perpendicular line. (After clicking drag a line to point B)

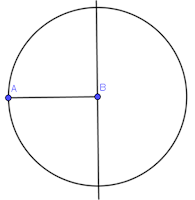
9. From point B draw a circle through point A using the Circle with Centre through a Point tool

10. Now add a new point C on the intersection point.

11. Repeat step 8 to draw a perpendicular line. (This time drag a line to point A)

12. From A draw a circle through B using the Circle with Centre through a Point tool

13. Now add a new point D on the intersection point.


14. Now click polygon tool and click on the point A and drag the line to point B then to point C and finally to point D to make a square.


15. Hide the circles by right clicking them and deselecting Show Object.


Output:


No comments:
Post a Comment